Does how much Vitamin C that is in food depend upon how long it is cooked for?
You will need:Bell peppers without their seeds, some raw and some boiled, test tubes and a test tube rack, a 10cm3 measuring culinder, DCPIP solution, teat pipetttes, scissors, pestle, mortar, fine sand, top pan balance and a stopclock.What you do:
Safety:Use caution when boiling peppers - your teacher may have pre-boiled them for you. Tell your teacher if you are allergic to pepper. Wear goggles when using DCPIP to prevent it going in your eye. |  |
An investigation into how the mass of a salt affects the temperature change in an endothermic reaction
Hypothesis: As the mass of the salt added increases, the temperature change will increase
Context: How much solute is needed for a sports injury pack to make it most effective?
Equipment
- Polystyrene cup
- Potassium chloride
- Thermometer
- 25ml measuring cylinder
- Spatula
- Balance
- Weighing boat
- Weigh 0.5g of potassium chloride in a weighing boat using a balance
- Measure out 25ml of water using a measuring cylinder and pour into a polystyrene cup
- Record the temperature of the water
- Add the potassium chloride, stir and record the minimum temperature reached
- Repeat for 1g, 1.5g, 2g and 2.5g of potassium chloride
- Record the temperature changes in a table
- The process of dissolving can be endothermic (temperature goes down) or exothermic (temperature goes up).
- When water dissolves a substance, the water molecules attract and “bond” to the particles (molecules or ions) of the substance causing the particles to separate from each other.
- The “bond” that a water molecule makes is not a covalent or ionic bond. It is a strong attraction caused by water’s polarity.
- It takes energy to break the bonds between the molecules or ions of the solute.
- Energy is released when water molecules bond to the solute molecules or ions.
- If it takes more energy to separate the particles of the solute than is released when the water molecules bond to the particles, then the temperature goes down (endothermic).
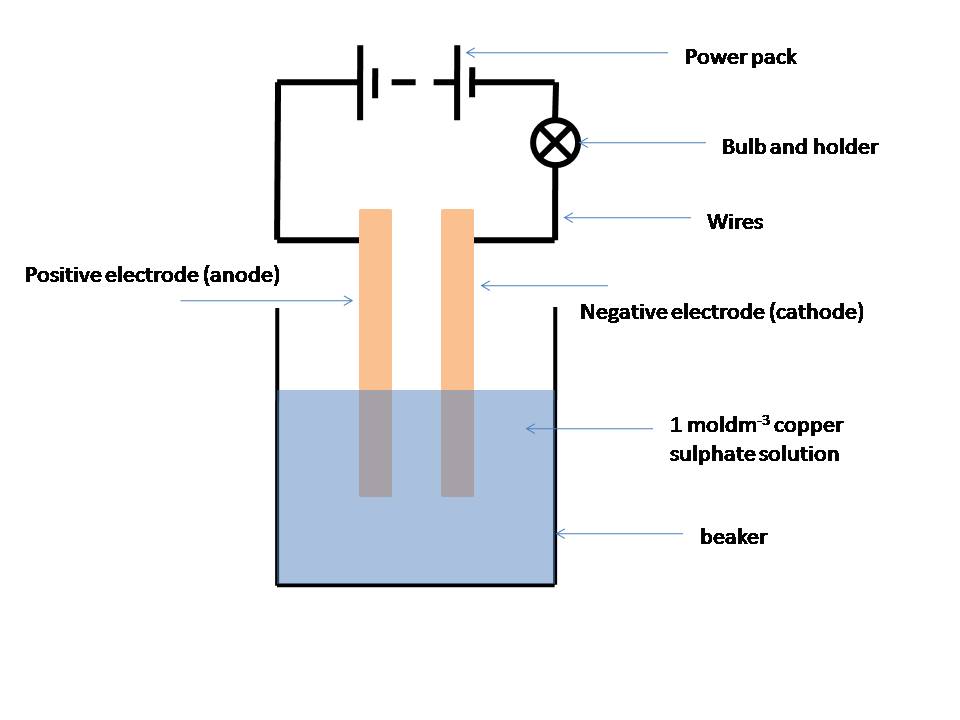
An investigation into how the time that the current flows affects the mass of metal deposited in an electrolysis experiment
Hypothesis:
The mass of copper deposited on the negative electrode increases as the time the current flows for increases.
Equipment:
|  |
Method:
-
Measure 70cm3 of 1moldm-3 copper sulphate solution into a 100ml beaker
-
Set up a circuit with a power pack set to 6v, and connect a bulb to the negative terminal with a wire.
-
Connect another wire to the bulb and attach a crocodile clip.
-
Connect a wire to the positive terminal of the power pack and attach a crocodile clip.
-
Measure the mass of the copper strip you are going to make the negative electrode, and record it.
-
Attach this to the negative crocodile clip and attach another copper strip to the positive crocodile clip.
-
Place both electrodes in the beaker, turn the power pack on and press start on the stopclock.
-
Stop the stopclock after 5 minutes and turn off the power pack.
-
Wash the electrode with distilled water, then acetone and leave to dry.
-
Reweigh the negative electrode and record the mass.
-
Repeat the experiment for different times, e.g.10, 15, 20, 25, 30 minutes.
Safety:
Copper sulfate is harmful, slightly toxic by ingestion and a slight skin irritant so wash it off with water if you get any on your hands, and wear goggles during the whole experiment. If you spill any, mop it up with a paper towel and wash your hands immediately. Don't touch the power pack with wet hands as it could give you an electric shock. Dry your hands first. Don't turn on the power pack until you are ready to take your results. Do not let the electrodes touch as they will cause a spark. Be careful when handling the beaker. If you have wet hands you could drop it, it could smash and cut you. Ask a teacher to clear up any broken glass; don't do it yourself.
An investigation into how different temperatures affect the viscosity of washing up liquid
Hypothesis:
The viscosity of a liquid is dependent upon the liquid’s temperature.
You will need the following equipment:
- 250 cm3 beaker (to act as a water bath)
- Boiling tube
- Clamp stand
- Dropping pipette
- Kettle (to make the temperature of the water bath)
- Plastic tray
- Stop clock
- Thermometer
- Washing up liquid (10 cm3)
- White tile
Method:
- Draw 2 lines on the white tile (approximately 10 cm apart)
- Place the white tile inside the plastic tray
- Use the clamp stand to angle the plastic tray (approximately 45o)
- With the thermometer, measure the temperature of the washing up liquid
- Using the dropping pipette, place 1 drop of washing up liquid onto the upper line of the white tile, start the stop clock
- Measure the time taken for the washing up liquid to travel to the bottom line of the white tile
- Record the result into your results table
- Prepare a water bath to heat the washing up liquid to 30oC
- Repeat steps 1-7, increasing the temperature by 10oC each time (do not go above 60oC)
Below are previous investigations.
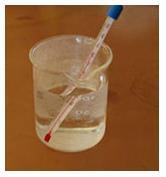
Does Jelly set quicker in wide bowls or narrow beakers?
Hypothesis: There is a link between how fast a liquid cools down and the surface area of the container.
Imagine you are a party planner and someone has requested 100 jellies for a child's birthday party. All the jellies will be the same volume. Hot water is needed to dissolve the jelly.
Will the jellies set quicker in wide bowls or narrow beakers?
Method:
We can simulate the cooling of jelly by using water.
1. Measure 100ml of 60 degree C water into a 100ml beaker using a measuring cylinder.
2. Measure the temperature of the water with a thermometer or temperature probe and record it.
3. Start a stopwatch. Record the temperateure of the water every minute for 10 minutes.
4. Repeat the investigation with 100ml of 60 degree C water into a 250ml beaker.
5. Repeat the investigation with 100ml of 60 degree C water into a 500ml beaker.
6. Measure the diameter of the beakers and calulate the surface area of each beaker using the formula
SA = 3.142 x (d/2)^2
7. Record the surface area of each beaker
8. Plot the temperature against the time in minutes for each beaker on the same axes to show their cooling curves.
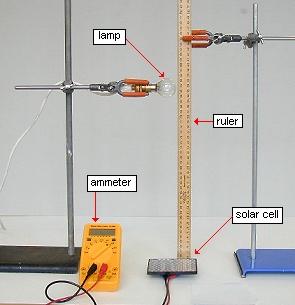
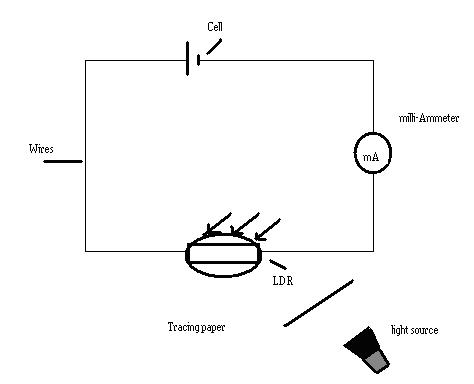
How is light absorbed by different thicknesses of tracing paper
 |
Objectives: To plan an
experiment to look at how size of cell affects a solar cell output voltage To write a detailed plan for the experiment To plot a good graph of the results
|
Apparatus list: LDR, sheet of tracing paper, 30cm ruler, light source, scissors, power supply, milli-ammeter, wires
1. Collect the apparatus.
2. Cut tracing paper into 10 equal sized pieces
3. Place the light source 30 cm from the solar cell
4. Make sure the room is dark
5. Switch on the light source and measure and record the solar cell voltage
6. Add one sheet of tracing paper
7. Measure and record the solar cell current using a multimeter
8. Add a second sheet of tracing paper
9. Measure and record the solar cell current using the multimeter
10. Add further pieces of tracing paper until 10 thicknesses are achieved
11. Repeat the experiment two further times
12. Calculate the average LDR current in microamps
Dependent variable: Number of sheets of tracing paper
Independent variable: Light level
The control variables were distance of the lamp from the solar cell, the type of solar cell, the background light level, the type of tracing paper, power of the light source, angle of the light source to the light meter, voltage of the power supply.
It was made a valid experiment by keeping everything the same apart from the independent variable.
It was made a reliable experiment by repeating the experiment 3 times and averaging.
Here are some other websites you might find useful when planning your experiment.
|
|
